Grids
Data is displayed in the form of table or tree data structures. You can download the data in Excel format
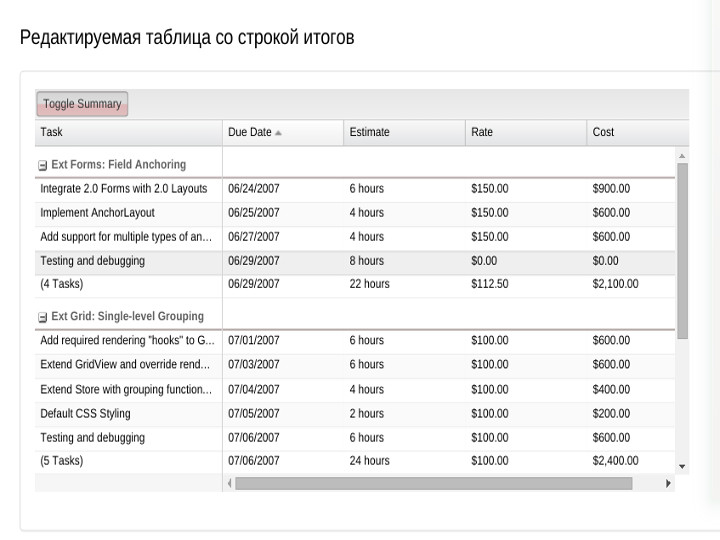
Cell Editing Summary
- Standard
- |
- Editable
This grid demonstrates the use of the Grouping Summary Feature with server-side summary calculation (results are intentionally wrong).
We use hi-tech only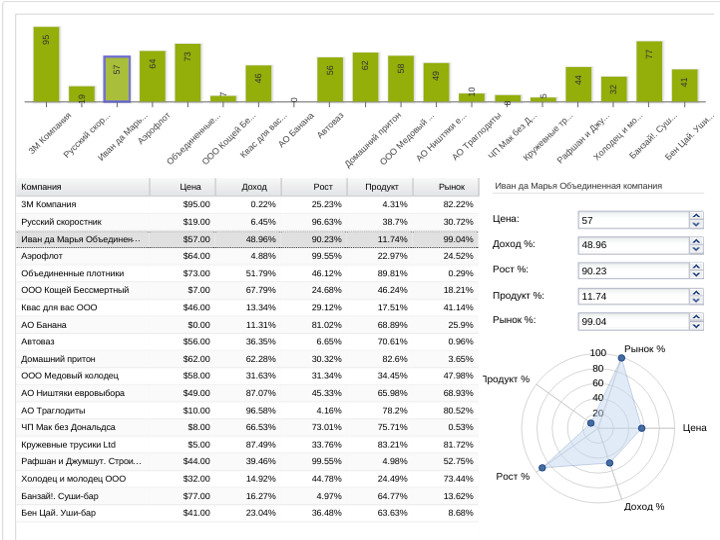
Dashboard
- Standard
- |
- Complex
Showing companies information in a grid. Selecting a row will highlight the bar corresponding to that company and fill in the form with the company data.
We use hi-tech only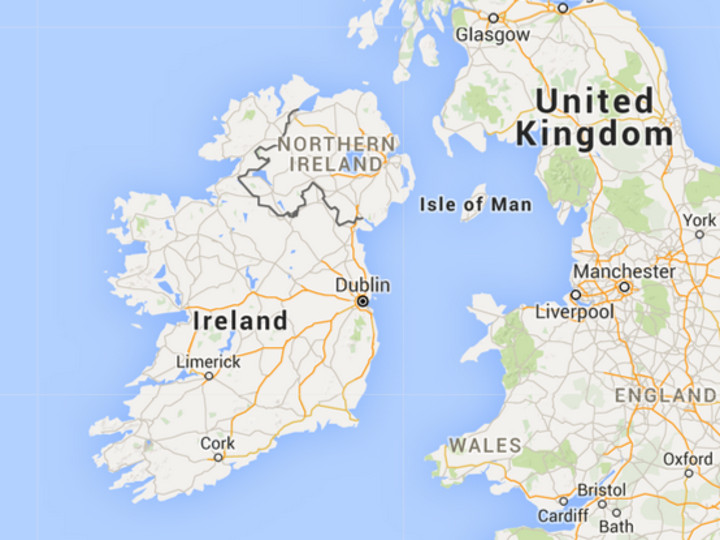
Google Map
- Standard
Google map. Could be configured. You can set a few pinpoints on the map
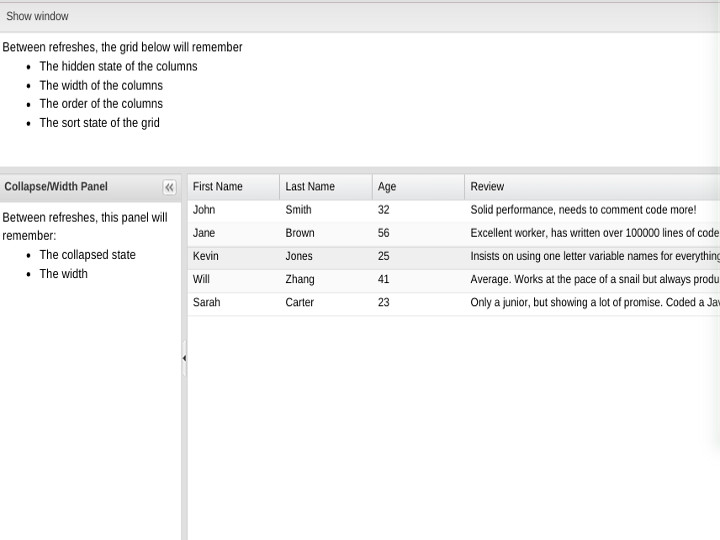
Layout
- Standard
- |
- Complex
The hidden state of the columns, the width of columns, the order of columns, the sort state and other params of the grid will be remembered between refreshes.
We use hi-tech only