Diagrams
Renders data in different ways using Extjs components. You can download rendered data in the form of diagram or table.
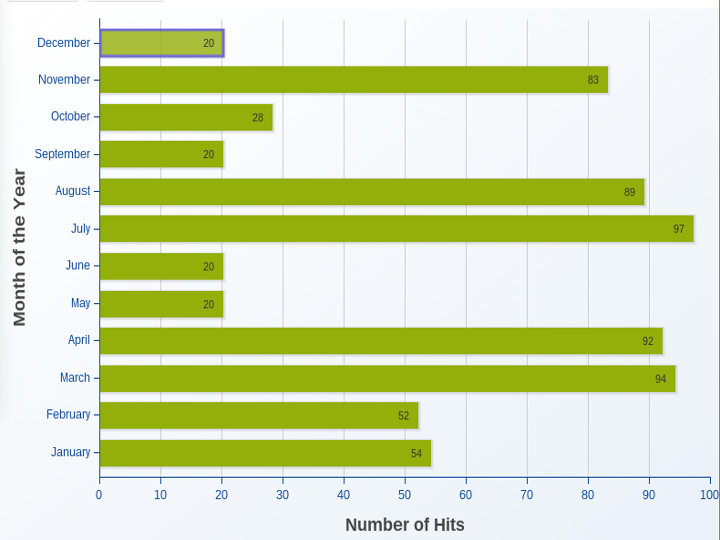
Bar Diagrams
- Standard
- |
- Colored
- |
- Stacked
- |
- Groupped
Display a sets of random data in a bar series. Reload data will randomly generate a new set of data in the store.
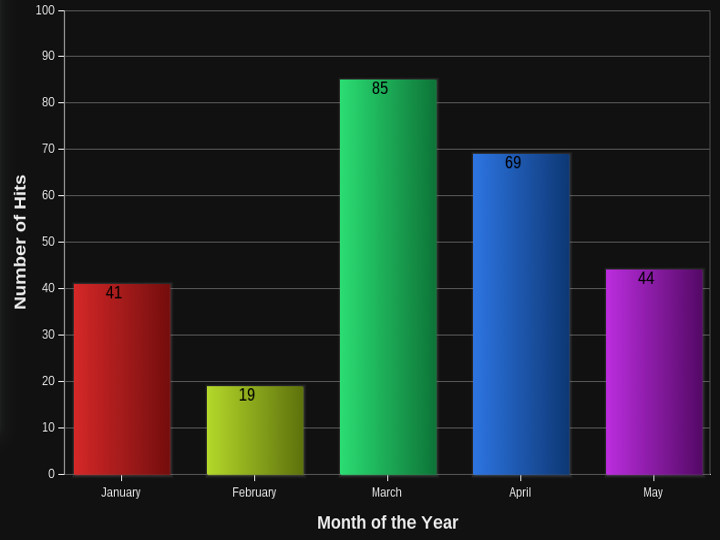
Histograms
- Standard
- |
- Custom
Data is rendered in form of vertical columns, the color of the columns may be changed as required
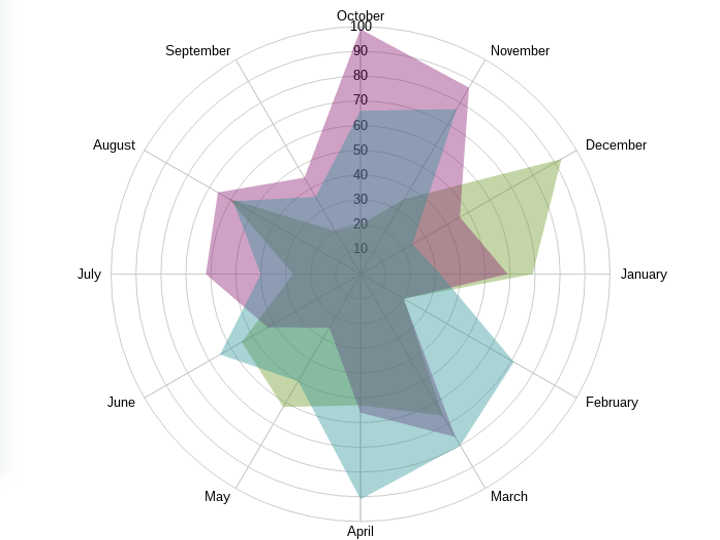
Radar Charts
- Standard
- |
- Filled
Renders series of data in the form of colored areas or polygons
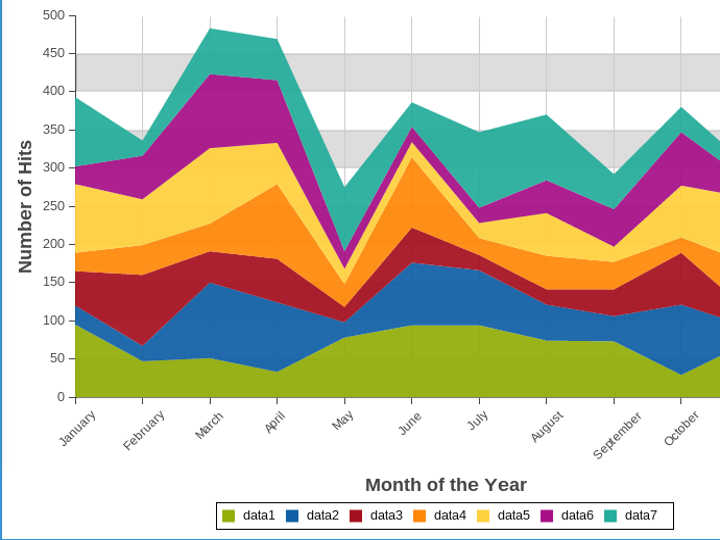
Area Charts
- Standard
- |
- Custom
Display sets of random data in an area series. Reload data will randomly generate a new set of data in the store. Click or hover on the legend items to...
We use hi-tech only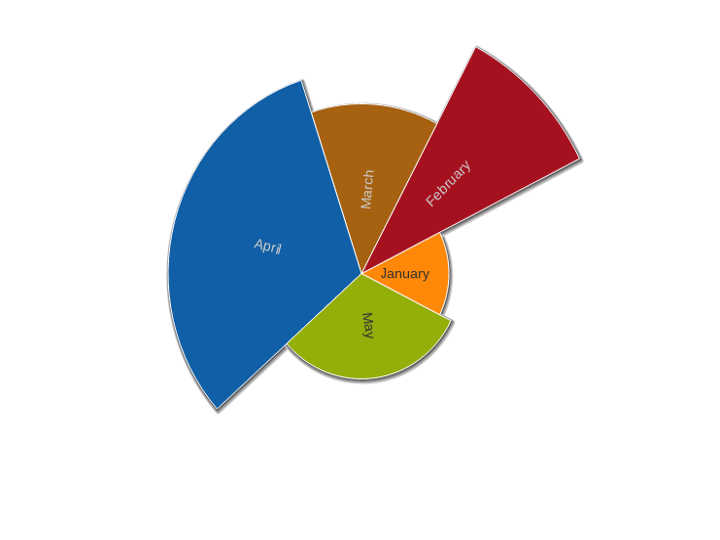
Segment Charts
- Standard
- |
- Custom
Display browser usage trends in an area series. This chart uses custom gradients for the colors and the legend is interactive...
We use hi-tech only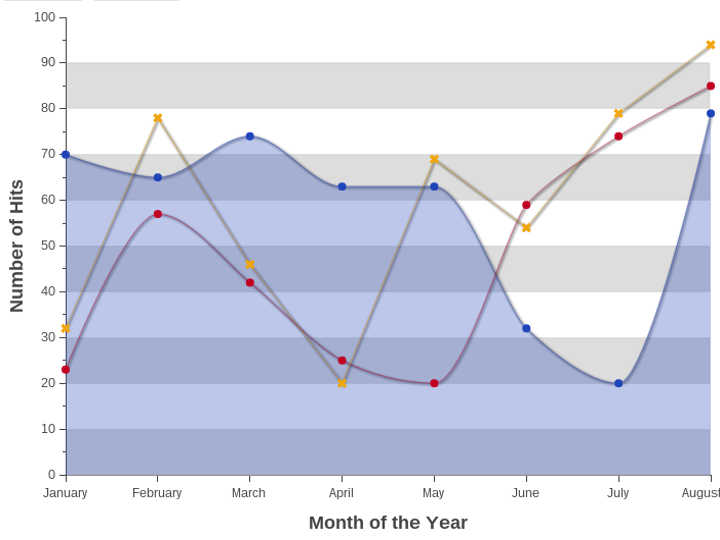
Line Charts
- Standard
- |
- Filled
- |
- Mixed
Data is rendered in the form of lines going through control points. The area under each line can be painted.
We use hi-tech only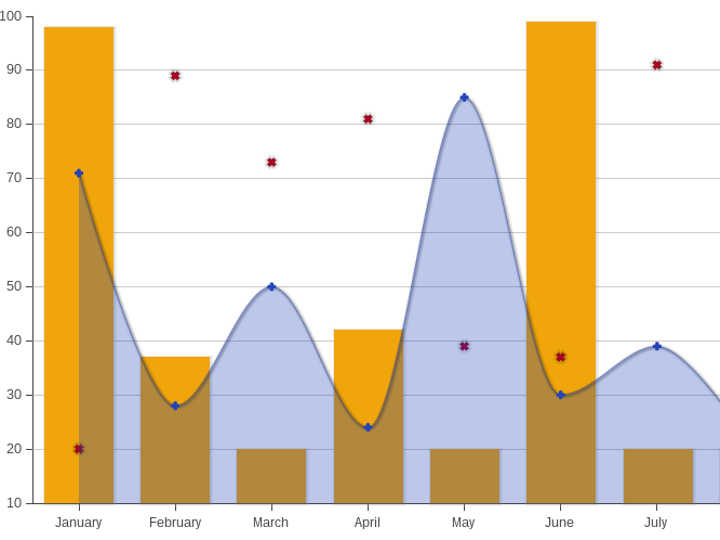
Mixed Charts
- Mixed
Data on mixed diagrams could be rendered on diagrams of different types at the same time
We use hi-tech only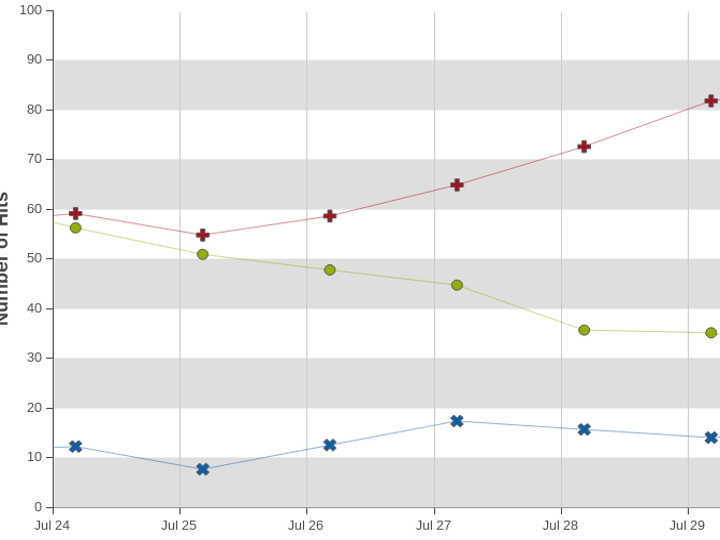
Live Charts
- Standard
Data sets are rendered in the form of animated line going through control points.